A software-as-a-service time and attendance platform spanning rostering, timekeeping, breaks, leave, compliance and the payroll feed, across equity and franchised restaurants. The business did not own it. The vendor released features on its own schedule; the business negotiated.
My roleOne of two experience designers running the review. Research, synthesis, the blueprint, the scoring workshop and the vendor reconciliation.
CollaboratorsPeople-systems, payroll and IT; restaurant managers, team members and area coaches as participants; a franchisee.
ConstraintsVendor roadmap outside our control. Forecast and role data arriving late from global systems. Payroll cycles and configurations that differ by franchise group by design.
Key decisionTreat the brief as an alignment problem, not a feature list. Build the instrument that lets priority disputes be settled by evidence: a blueprint that locates every pain point and a scoring model published before any score is written.
DeliveredThe blueprint and the scored top ten, with the criteria agreed before any score was written, accepted as the standing prioritisation. The blueprint runs as a living document on a half-yearly review.
ReleasedEight of the ten carried a named vendor release: three in release 1.63 in November 2024 and five in release 1.64 across 2025. Some were already on the vendor calendar and were fast-tracked; others were negotiated. Ten further vendor releases followed in early 2026.
MeasuredThe release record is the measure that exists. The satisfaction and labour-cost measures in section 6 were designed at the close of the review, and the figures sit with people-systems and payroll.
Shown hereOriginal artefacts, anonymised: the blueprint poster, redrawn from the delivered blueprint, the interview synthesis and the scored proposals. Later concept: the nine-module interface, designed in September 2026. A release label on a module names functionality the vendor implemented, not the screen.
The problem
The platform had replaced a legacy time system and most managers preferred it; the mobile app in particular. But the business had accumulated a long backlog of wanted features across real-time data, mobile functionality and rostering flexibility, and nobody could rank it. Restaurant managers, payroll, IT and compliance each had a different list. The vendor kept releasing its own roadmap. A stakeholder-weighted prioritisation model built during implementation had been discarded. The visible ask was a system-improvement exercise: prioritise and implement critical fixes, reduce labour-cost inefficiency, mitigate compliance risk, reduce staff frustration and standardise across equity and franchise.
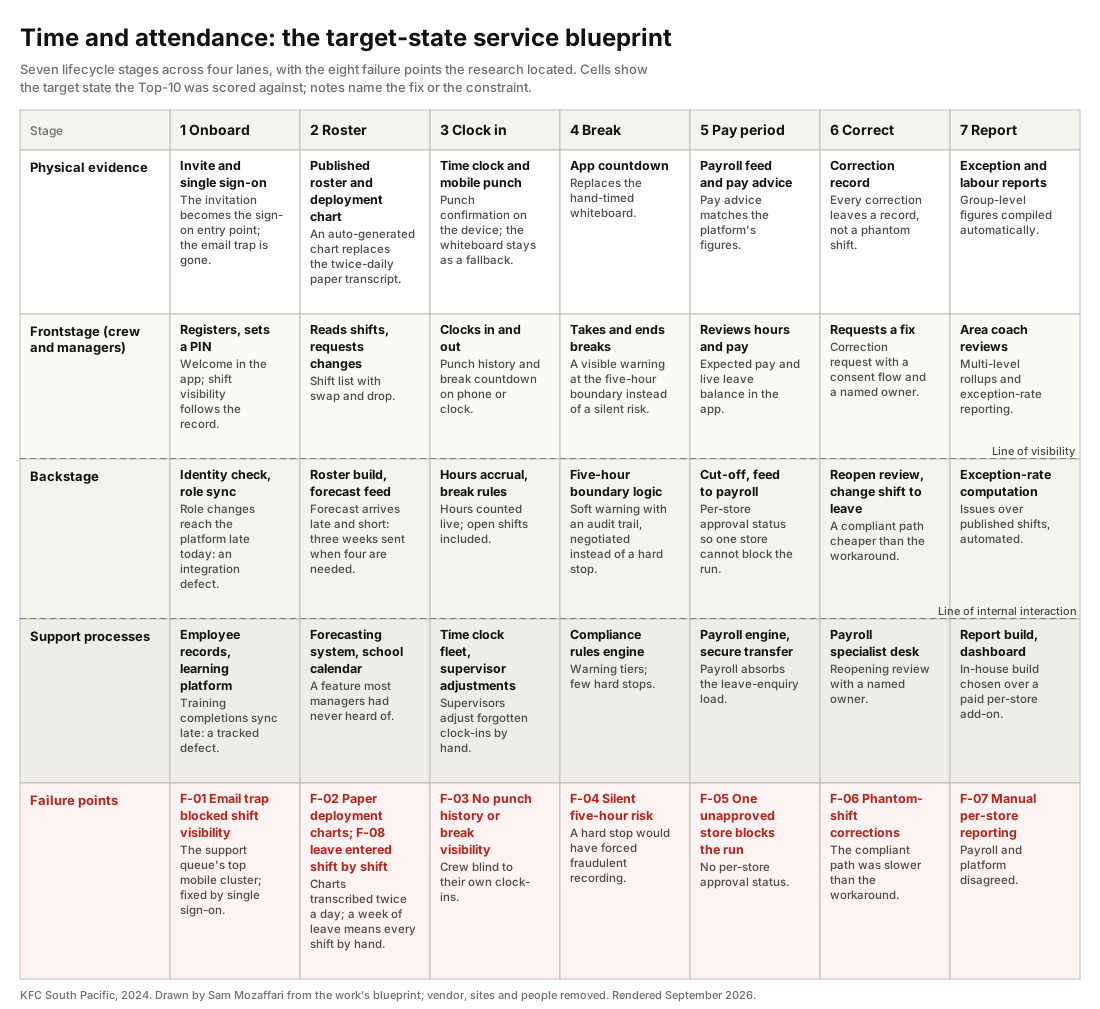
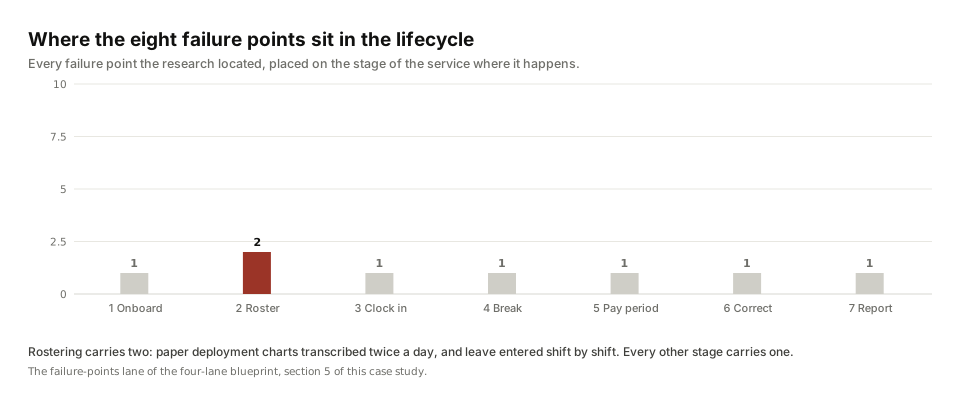
The people living with it said the real problem plainly: the biggest pain point was prioritising development across so many stakeholders. Underneath that, the compliance layer was quietly failing. Managers faced a warnings list so long they stopped reading it, and hard stops on common shift patterns pushed managers into recording things that were not true just to get a pay run through. The workarounds were physical: paper deployment charts transcribed twice a day, whiteboards above time clocks, spreadsheet rosters, printed break sheets, phantom shifts entered to unblock payroll.
Every recurring workaround was evidence of a missing feature, and without a shared way of ranking them the vendor conversation went nowhere. The cost was not only manager time; it was a compliance layer that people had learned to route around.
What I did
We designed the research to map the whole lifecycle rather than to collect complaints, and we triangulated four methods so no single voice could set the priority.
- More than 50 semi-structured interviews with team members, restaurant managers, area coaches, IT support, people-systems and payroll, across equity and franchised restaurants. They included an above-restaurant round with a franchisee, two area coaches and payroll.
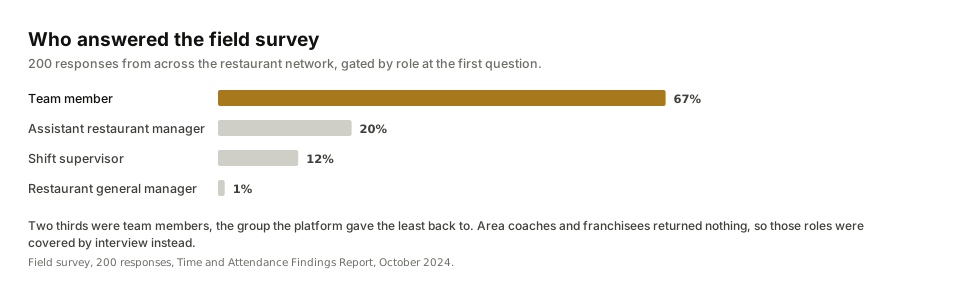
- A role-branched field survey that returned 200 responses: one instrument, a role gate at the start, six branch paths. Two thirds of respondents were team members. The area-coach and franchisee branches returned nothing, which we read as a sampling signal rather than a finding, and covered those roles by interview instead.
- Site visits and contextual inquiry in ten restaurants, six franchise and four equity, watching the time clocks, the printed rosters, the deployment whiteboards and the laminated charts, and photographing every workaround we found.
- A support-queue analysis of six months of mobile-app tickets to quantify failure demand.
Existing data sat beside the four methods: the network-wide employee engagement survey, with about 30,000 responses a year.
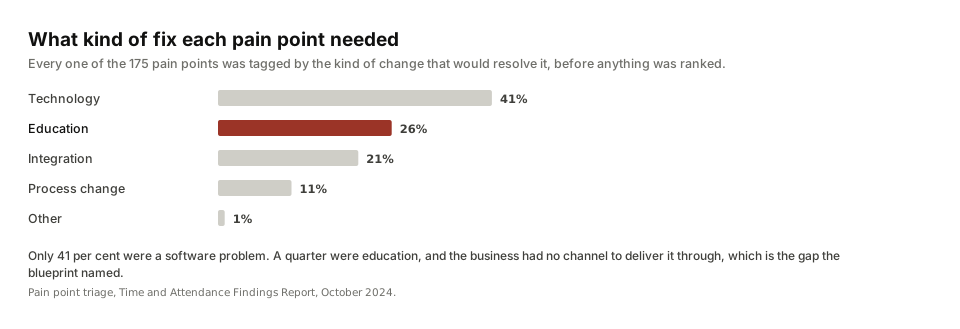
That fieldwork produced 175 pain points, each one typed and triaged. Synthesis ran on a shared wall with the restaurant, people-systems, payroll and IT stakeholders while a spreadsheet kept the digital twin. The taxonomy was the load-bearing move: every pain point was tagged by solution type (technology, education, integration, process) and by backlog status (already planned, solvable but unplanned, outside platform scope). That one table showed at a glance which problems were the vendor's to solve, which were the business's, and which were nobody's because nobody had named them. Personas, two worked user journeys and the four-lane blueprint followed, and the review closed with a scoring workshop and a reconciliation pass against the vendor's release calendar.
What the research found
Alert fatigue, not non-compliance. The compliance warnings list was so overwhelming that managers dismissed warnings without investigation. That set the design philosophy for everything after: few hard stops, visible warnings everywhere else, with an audit trail.
Rules create their own workarounds. The swap-notice rule pushed team members to drop and re-pick shifts instead of swapping. Pay-period rigidity produced phantom shifts. A hard stop on breaks would have forced managers to record fraudulently. Each was a system-design decision before it was a behaviour problem.
A quarter of the problems were education, with no delivery vehicle. Feature availability varied store to store with no baseline; most managers had never heard of the school-calendar feature; report literacy was low. The blueprint named a gap the business had never named: there was no channel to deliver that education through.
Data credibility is a design surface. The payroll figures and the platform figures disagreed, and area coaches, payroll and managers all said so. We treated that as an experience problem to design for, not an IT complaint to forward.
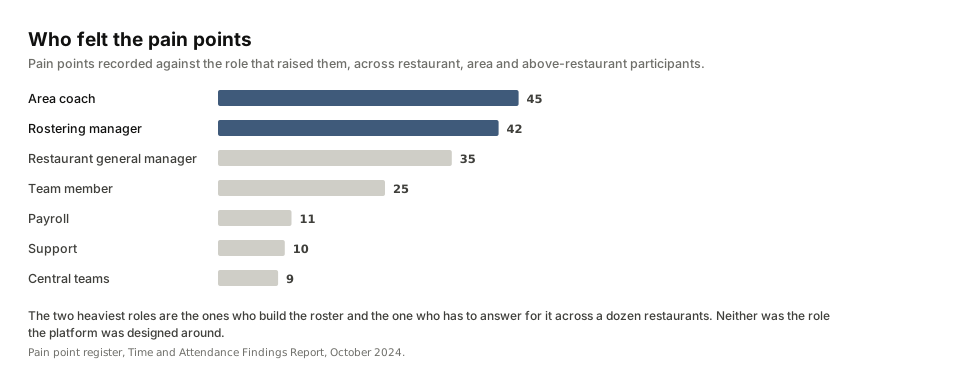
Integration latency is structural. Forecasts arrived late and short. Role changes took days to reach the platform. Training completions synced late. These were consequences of who owned each system, and the integration strand of the blueprint is the one that is easiest to leave out.
Four decisions
Treat the brief as an alignment problem, not a feature list
Evidence. The discarded weighting model; four functions with four lists; the vendor roadmap ruling by default; the stakeholders' own words about prioritising across so many people.
Alternative considered. A feature-fix campaign against the visible ask. Rejected because it would have shipped random improvements and left the stalemate intact.
What we did. Built the instrument that makes priority disputes resolvable by evidence: a blueprint that locates every pain point in the service, and a scoring model agreed before any score was written.
Compliance ranks first by standing rule; everything else is weighted and published
Evidence. The previous model had been thrown out because nobody could defend it. Compliance failures carried the highest cost and were the ones people were routing around.
Alternative considered. Let the vendor's release calendar set the order, or reinstate the old weights. Rejected: neither survives a challenge from the functions that lost.
What we did. Six criteria agreed in the workshop: compliance impact (ranks first, always), labour-cost accuracy, team member experience, manager time, feasibility, cost and effort. Every item cites its insight and evidence count; nothing enters the list without one.
A visible warning at the five-hour break boundary, not a hard stop
Evidence. Existing hard stops on common shift patterns were already forcing false records. The boundary risk sat across 100,000+ rostered shifts.
Alternative considered. The hard stop the vendor had on its roadmap. Rejected and negotiated down: it would have handcuffed managers and produced fraudulent data, which is worse than a visible, audited risk.
What we did. Guided enforcement with visible warnings and an audit trail, quantified against the rostered shifts it protects. It became item one on the list.
Draw the blueprint's boundary at the manual adjustments
Evidence. Payroll cycles, reopening policies and leave handling differed by franchise group, and only the enterprise-agreement interpretation was uniform.
Alternative considered. One configuration imposed across the network. Rejected: it would have blocked the blueprint on franchise politics and misrepresented how the service works.
What we did. A standard feature list per restaurant and a deliberate variant tail. The blueprint ends where franchise autonomy begins, and says so.
What was delivered
The scored top ten, with the design principle and backlog status each item carried into the vendor conversation. Items already on the vendor's calendar were adopted and fast-tracked; unplanned items were negotiated; one sat outside the platform's scope and became a business process.
| Rank | Item | Category | Principle | Release |
|---|---|---|---|---|
| 1 | Soft warning on shifts of five to five and a half hours | Compliance | Few hard stops, visible warnings | Released 1.63, Nov 2024 |
| 2 | Hard stop on shift supervisor breaks | Compliance | The one place a hard stop was right | Released 1.63, Nov 2024 |
| 3 | Manager break auto-wizard, rerun when a shift changes | Compliance | Remove a workaround | Released 1.64, 2025 |
| 4 | Reporting at multiple levels | Experience | One view per person | Released 1.64, 2025 |
| 5 | Shared employee punches and leave in one view | Compliance | One view per person | Scheduled |
| 6 | Auto-populated leave on the schedule | Compliance | Remove a workaround | Released 1.64, 2025 |
| 7 | Change a shift to a leave shift | Compliance | Remove a workaround | Released 1.64, 2025 |
| 8 | Consent workflow for leave | Compliance | Consent is not an admin step | Released 1.64, 2025 |
| 9 | Time off shift history | Compliance | Team members can see their own record | Released 1.63, Nov 2024 |
| 10 | Leave shifts on the mobile shift list | Experience | Team members can see their own record | Scheduled |
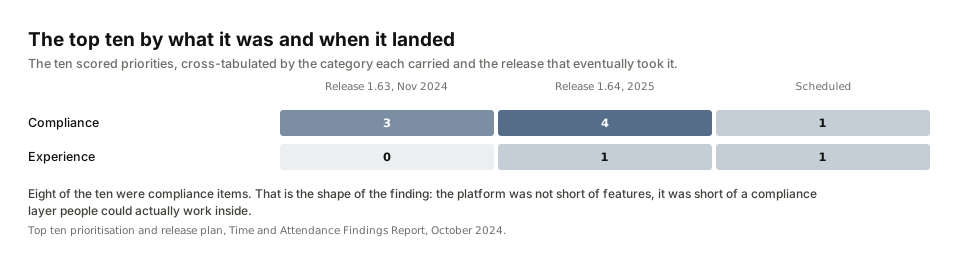
How the ranking was validated. A scoring model was published before any score was written, so the order could be argued with rather than appealed. The result went back through the platform user group and the franchise and area-coach channels across three milestones, which is where a prioritisation either survives contact with the people it affects or does not. The review closed with a reconciliation pass against the release calendar, item by item, with the business position recorded on each one.
Alongside it: the pain-point register tagged by solution type and backlog status, personas for team member, rostering manager, area coach and payroll specialist, two worked journeys (roster to clock to pay), a reconciliation table against the vendor's release calendar with the business position on each vendor item, a release-communication template routed through the platform user group and franchise channels, and the blueprint (Figure 1) as a living document.
The product the findings argued for
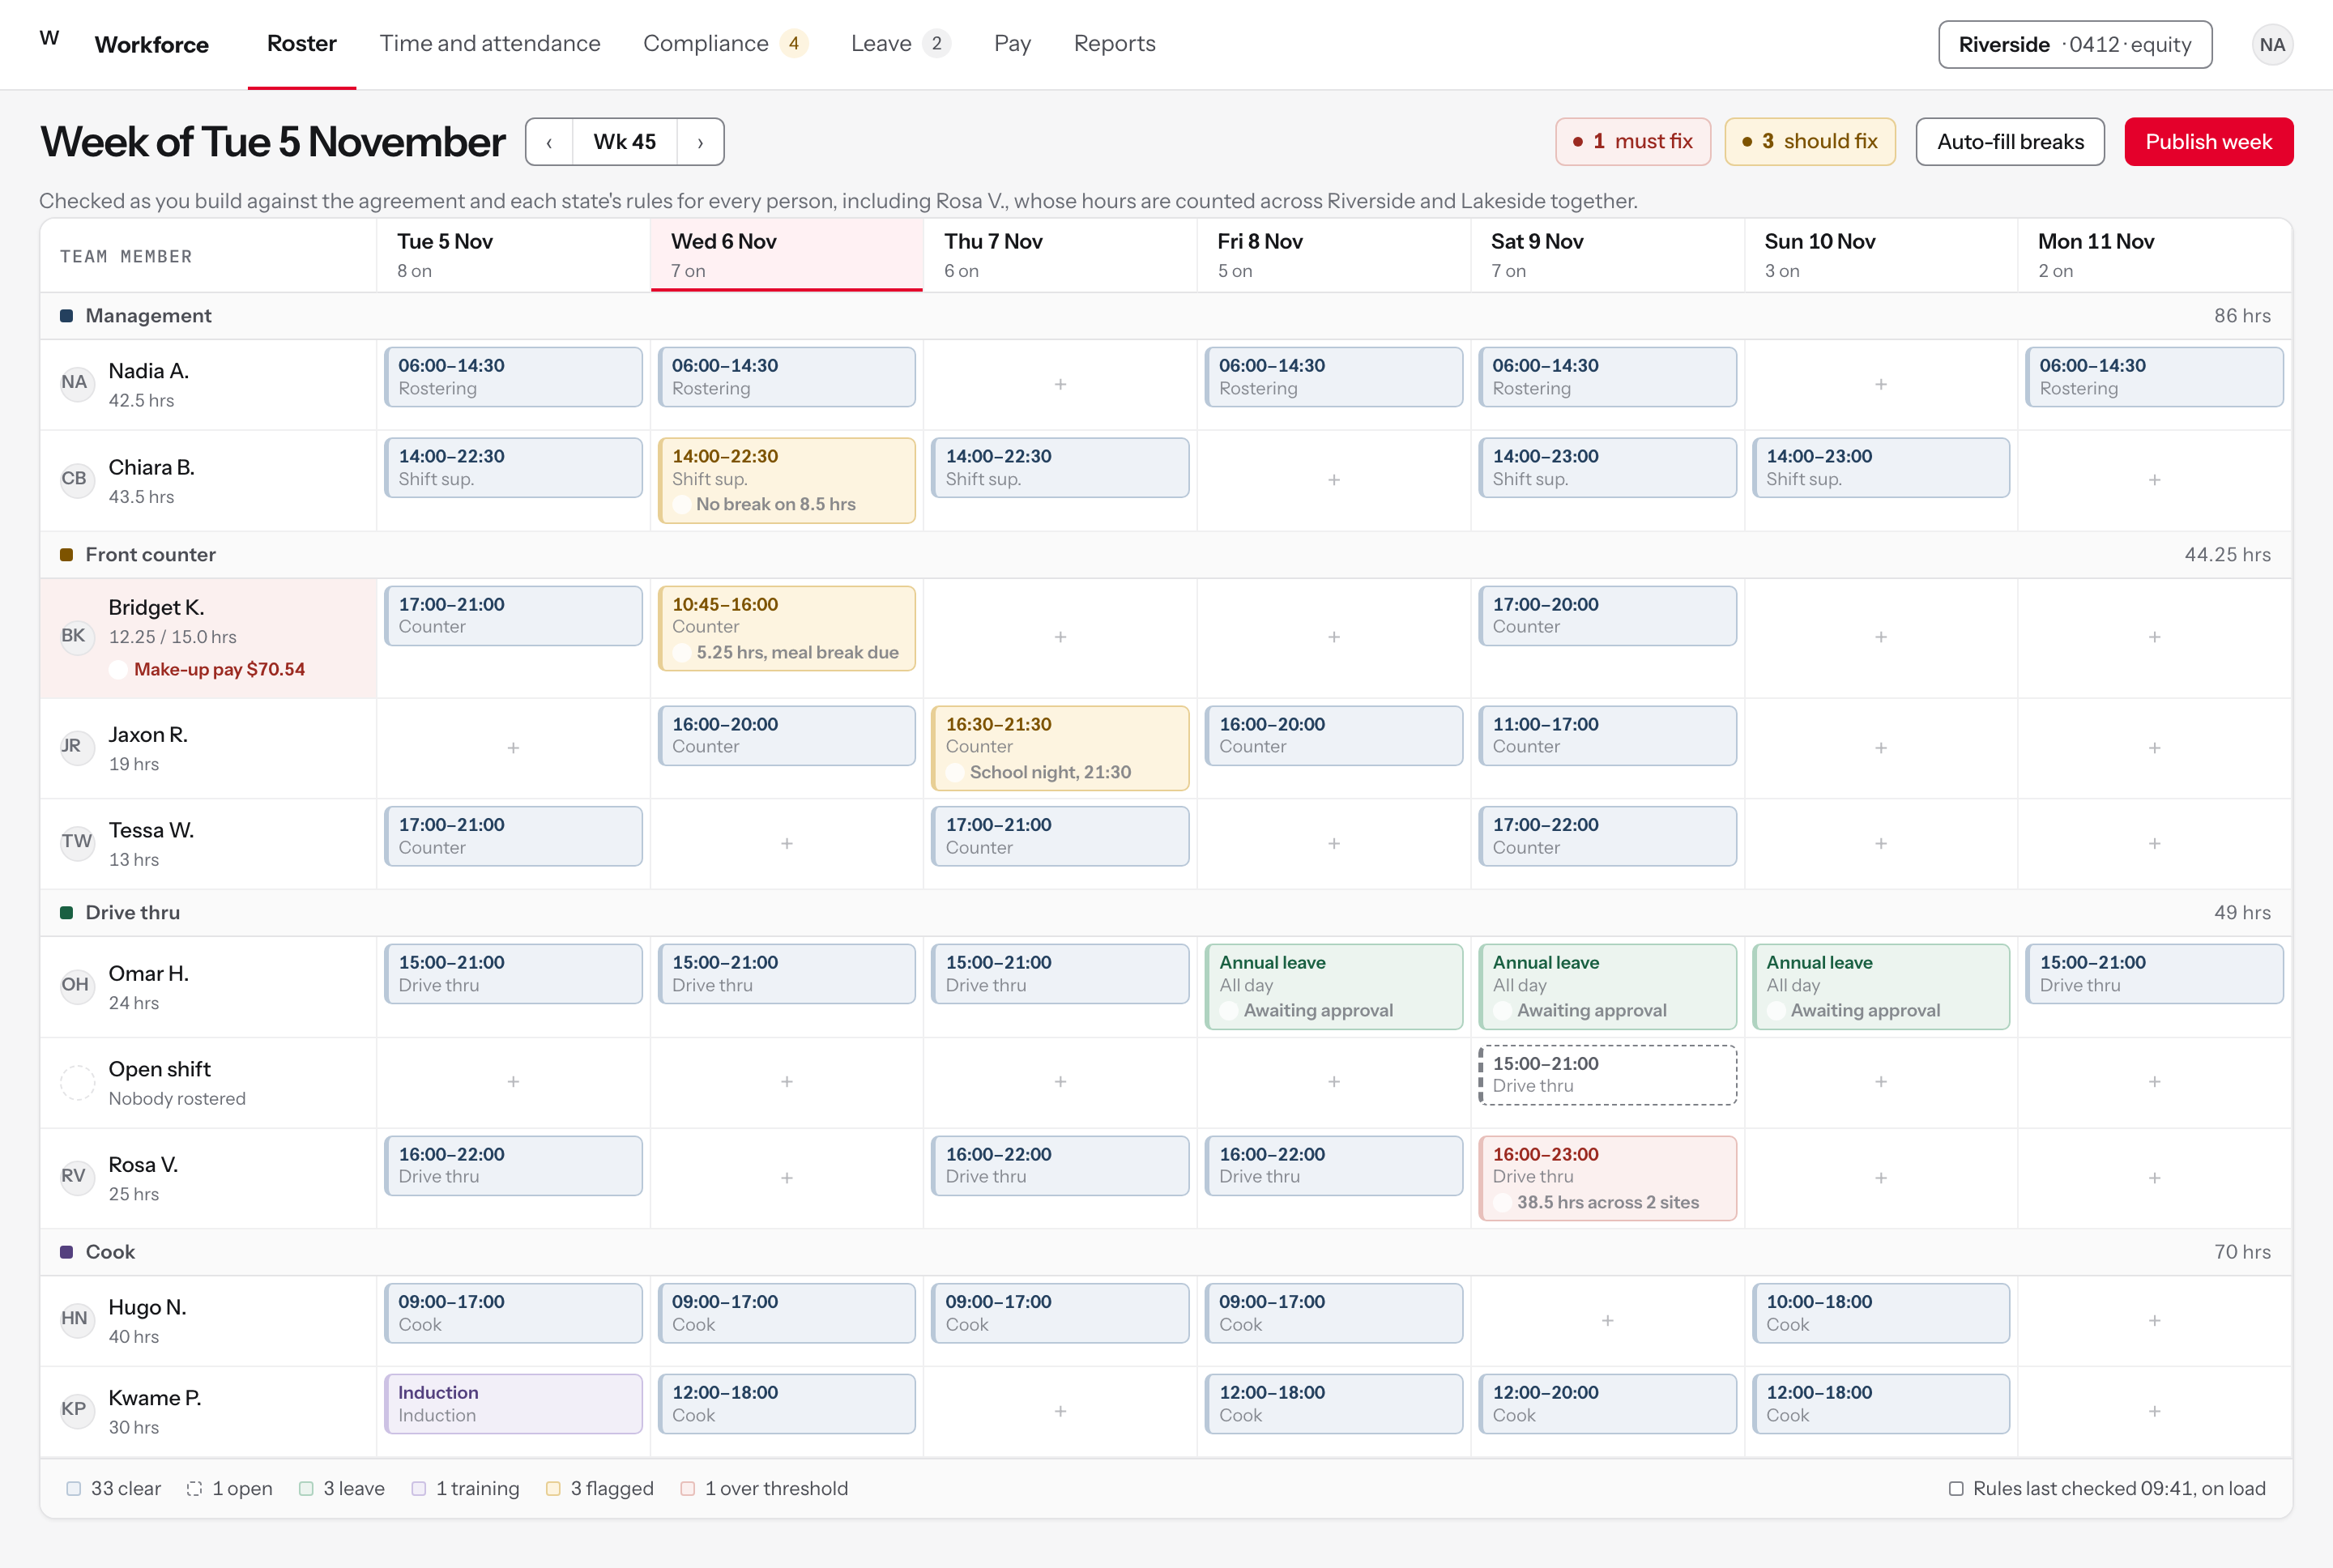
The report ended with a ranked list, and a ranked list is an argument about what to build. These nine modules are that argument drawn out, designed in September 2026: each one starts from a pain point in the register and shows the screen that answers it. Where the pain point was one of the ten and the vendor released it, the module says so; the release names the vendor's implementation, and the screen is my concept of it. They are built on the same design system as the safety reporting product, because a restaurant manager uses both in the same shift.
Explore the full concept, with every decision traced to the finding behind it.
Working files, anonymised: the interview synthesis and the scored proposals. The register, the personas, the journey map and the blueprint stayed working documents with the business.
How it would be measured
The measure that exists is the release record: eight of the scored ten carried a named release across November 2024 and 2025, and ten further releases followed in early 2026. The satisfaction and labour-cost measures below were designed at the end of the review rather than at the start, so this is the frame the next review starts from.
Every team member paid accurately, on time, first time, without anyone breaking a rule to get there.
DriversData freshness (age of labour figures); correction volume (phantom shifts, reopen requests); manual leave entries; team member self-service adoption; exception rate (compliance issues over published shifts, the area coach's manual spot-check automated).
LaggingSupport-ticket volume; payroll query load; compliance exceptions; manager hours on administration.
BaselinesThe support-queue analysis (mobile-app tickets over six months) and the pain-point register are the baselines that exist. Labour-figure age and correction volume need a baseline pulled before the next release.
CadenceHalf-yearly review of the blueprint and the list, per the living-document charter.
What I would do differently: build the measurement instrument in week one, name the education delivery vehicle in the roadmap rather than in a footnote, and baseline the service against a published standard before the first workshop.
Sponsor, scope and gates
The people-systems function, with payroll and IT as co-owners of the outcome.
Scope inThe end-to-end time and attendance service from restaurant floor to payroll: onboarding and access, rostering, timekeeping, breaks, leave, compliance and the payroll feed, across seven stages and four lanes.
Scope outThe payroll engine's internals beyond the feed, pay architecture, and any single configuration imposed on franchise groups.
Decisions requestedAdopt the scoring model as the standing prioritisation method; accept the top ten as the negotiating position; fund the in-house report build over the paid per-store add-on; establish the half-yearly review.
Timeline and gatesTwenty-four weeks: research (weeks 1 to 8), synthesis (8 to 12), mapping (12 to 16), prioritisation and reconciliation (16 to 24). Each phase closed with a stakeholder review before the next began.
StakeholdersRestaurant managers, team members, area coaches, a franchisee, IT support, people-systems, payroll, compliance, and the vendor's account and product teams.
Risks managedVendor roadmap outside our control (mitigated by reconciliation and joint acceptance); franchise autonomy (mitigated by the variant tail); survey non-response from senior roles (covered by interview); data credibility disputes (treated as a design surface).
What AI did and what stayed human
Fieldwork stayed human: consent, rapport, and the trust needed to hear about phantom-shift payroll fixes are not delegable, and neither is walking the restaurant floor instead of trusting the ticket queue. After the recording, AI helped: transcripts into structured write-ups on a standard template, and open-text survey answers and interview notes extracted into the pain-point schema for the triage sheet. Every extracted row was checked against its source before it counted, and ambiguous ones went to an orphans list rather than into the register. The wall synthesis, the taxonomy, the scoring criteria and every negotiation with the vendor were people's work.